Infrastructure
Latency is a cost that appears in every single fill
It never shows up on a rate card and it is charged on every trade you make. Desks comparing providers on spread alone routinely pay more in slippage than they saved on the quote.
Order sent to acknowledgement received, at your end not ours
The share of orders that actually executed
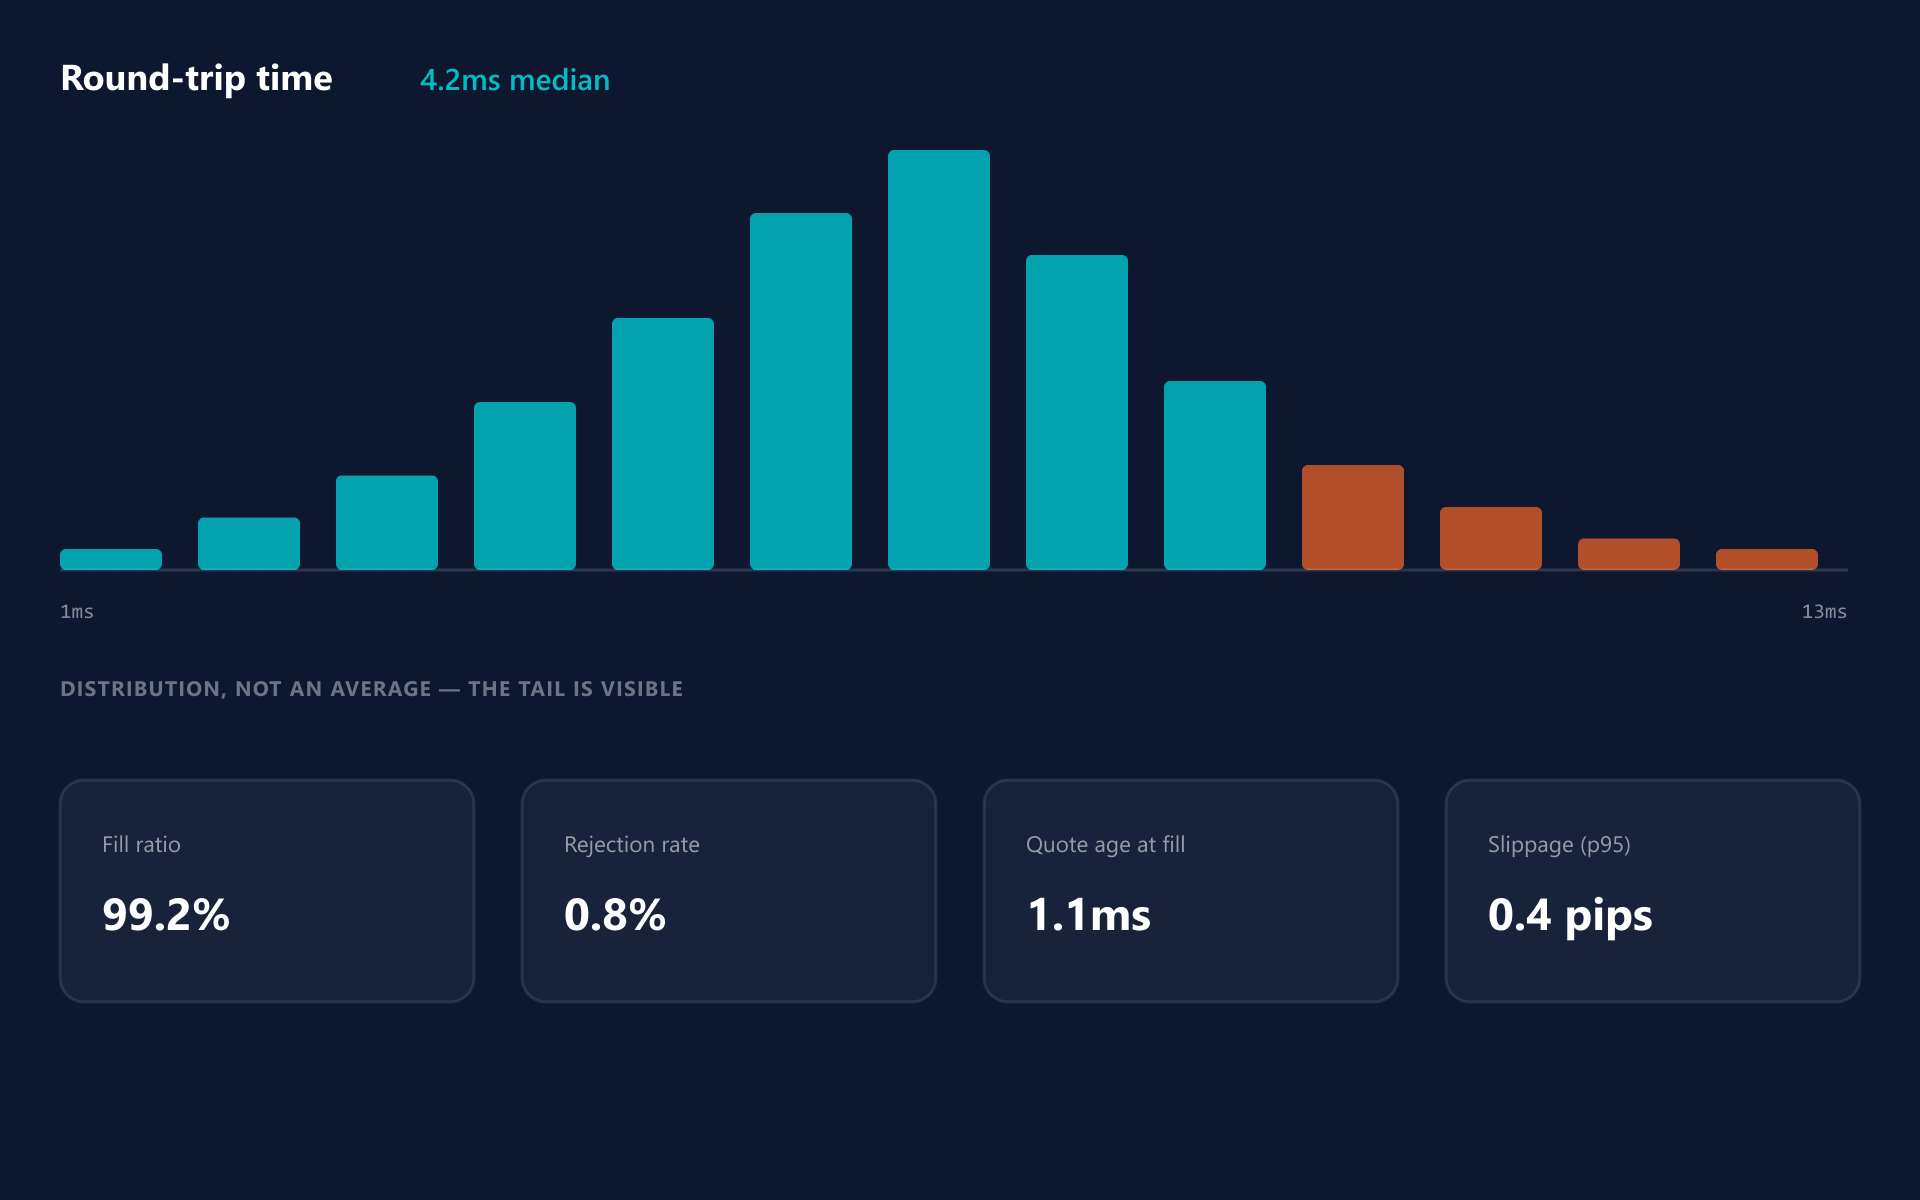
Not the average — the shape, including the tail
Why an order did not fill, by category
How stale the price was when it was hit
Worth being direct about
Including one about our own numbers
Present where the venues are
Pricing and matching infrastructure sits in the facilities the venues themselves use, across the main financial regions rather than in one place with long links out. Which region serves you is chosen for your client base, not for our convenience.
Agency routing, not a counterparty
Orders are passed straight through to the venue that priced them rather than filled against our own book. We are not on the other side of your flow, which removes the conflict that makes execution statistics worth arguing about.
Failover is rehearsed, not assumed
Standby infrastructure is kept current and cut over on a schedule in a closed market, with the result recorded. A backup nobody has ever switched to is a line item, not a recovery plan.
Traffic filtering in front
Volumetric and protocol-level filtering sits ahead of the pricing infrastructure, because an outage caused by traffic you never wanted looks identical to an outage caused by load you did.
Placement beats optimisation
Most of the latency in a typical setup is physical distance. Tuning software to recover a fraction of it while the server sits in the wrong region is effort spent on the smaller half of the problem.
Averages hide the cost
An average slippage figure looks acceptable almost always. The distribution shows the fills that hurt, and those are where the money actually goes.
Measure it yourself
Any provider's own latency figures are the ones they chose to publish. Reports are provided, and you should also measure independently — including against us.
See it live
Round-trip time, measured not assumed
Fill ratio, slippage distribution and quote age at fill, tracked over time so the tail is visible rather than smoothed into an average.
FAQ
Execution and latency: common questions
6 short answers to what teams ask before a demo.
Typically <30 ms, though the honest answer depends entirely on where your platform sits. A figure quoted without reference to your infrastructure is a figure about ours, not about what you will experience.
Not required, but it is the single largest lever available. Most of the latency in an ordinary setup is physical distance, and no amount of software tuning recovers what geography costs.
Round-trip times, fill ratios, the slippage distribution rather than just its average, rejection reasons by category, and quote age at fill. The distribution matters most — averages make almost any setup look acceptable.
Verify them. Any provider's published numbers are the ones they chose to publish. We supply reporting and we would rather you measured independently, because a desk that has measured is one that will not be surprised later.
Because the average is dominated by the ordinary fills that were fine. The cost lives in the tail — the fills during fast conditions — and an average is specifically designed to hide a tail.
No. It matters most where prices move fastest and spreads are tightest, which usually means currencies and digital assets. On a slower-moving contract the difference is real but much smaller.
Still have a question?
A specialist will answer it directly, with your set-up in mind.
Ask a specialistHave you measured your own round trip?
Most desks have not, and it usually explains more about their execution quality than any provider comparison they have run.