Services
Most platform incidents announce themselves first
A feed goes stale before clients trade the wrong price. Rejections climb before fills stop. Disk fills before the server dies. The question is only whether anyone is watching, and whether they can act.
See it live
What actually fires, and why
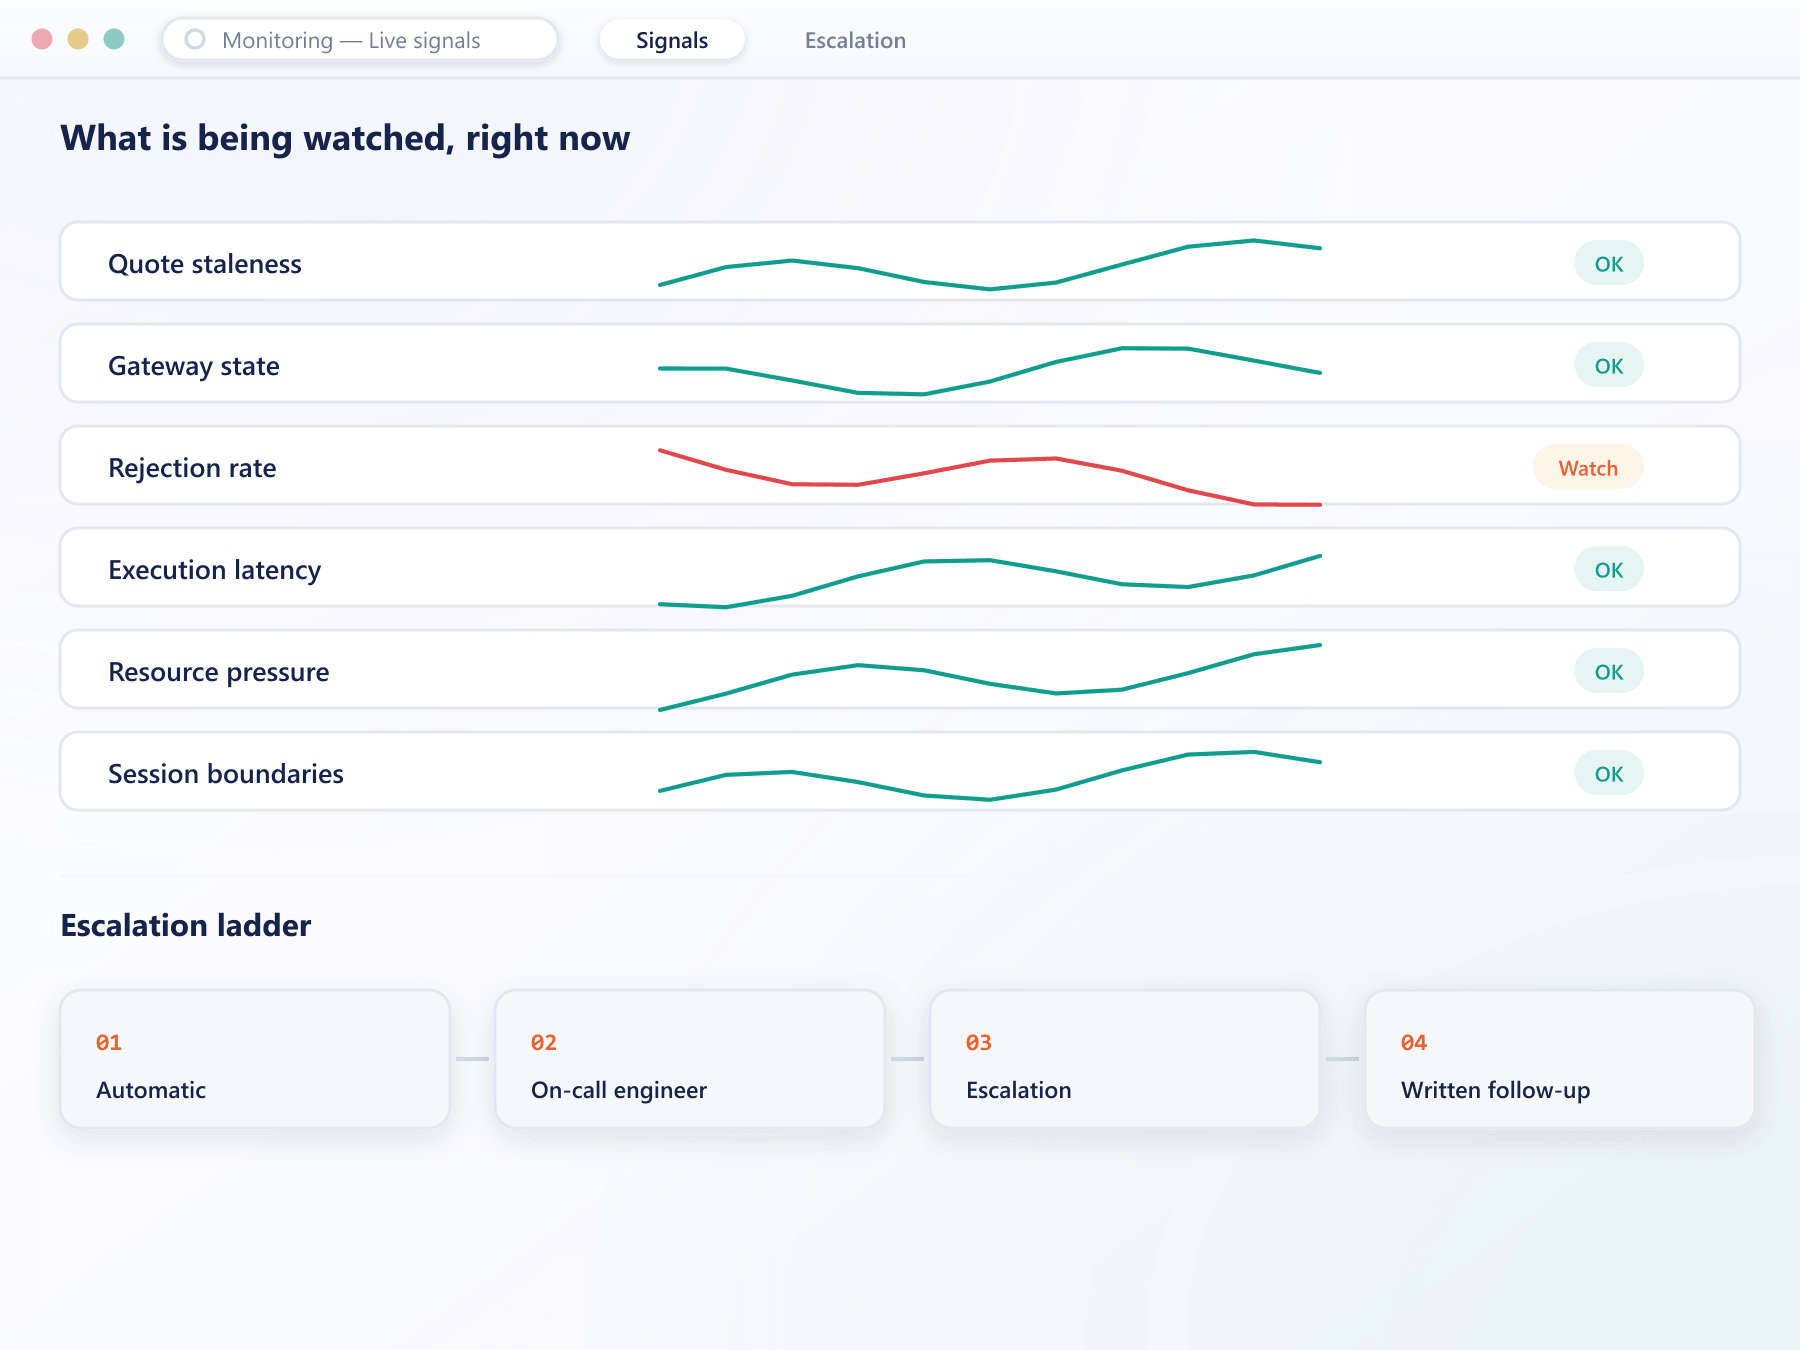
Quote staleness, gateway state and rejection rate sit in the same alert list your on-call engineer is actually watching, not a dashboard built for a demo.
The signals
What is watched, and what each one is telling you
A feed that stopped updating but has not disconnected
Clients trade a price the market has left behind
Connection drops, reconnect loops, sequence gaps
Orders route to a destination that cannot fill them
A rising share of orders refused by a destination
The earliest sign a provider is degrading
Time from order to acknowledgement, per destination
Slippage rises before anything visibly breaks
Disk, memory and connection counts against headroom
The failure that takes the whole server, not one symbol
Instruments trading outside their configured session
A calendar error, found before a client finds it
The escalation ladder
What happens after something fires
Automatic
ImmediateDefined conditions trigger a defined response without waiting for a human — falling back to a secondary feed, disabling a failing gateway, suspending a symbol whose price source has gone stale.
On-call engineer
MinutesAnything not covered by an automatic response reaches a named engineer who knows your environment, not a general queue that has to read your documentation first.
Escalation
As agreedIf the first responder cannot contain it within an agreed period, it escalates to a senior engineer and to whichever of your people you have nominated.
Written follow-up
After the factAn account of what happened, what was changed, and what will prevent a recurrence. Sent to you, not published on a status page and left there.
Three things worth saying plainly
Monitoring fails in predictable ways
Alerts that fire constantly are not monitoring
A channel that produces noise every hour gets muted within a fortnight, and then nothing is being watched at all. Thresholds are tuned until an alert genuinely means something.
Someone has to be awake
Monitoring without an on-call rota is a dashboard. The value is not in detecting the incident at 3am; it is in someone acting on it at 3am.
Your channels, not ours
Alerts route into the tooling your team already uses, so an incident does not first require somebody to log into a system they only visit when something is broken.
FAQ
Monitoring and alerting: common questions
6 short answers to what teams ask before a demo.
Quote staleness, gateway and session state, rejection rates per destination, execution latency, resource pressure on the servers, and whether instruments are trading within their configured sessions. The list is tuned to your environment rather than applied generically.
Continuous coverage is the standard arrangement, with a named engineer on your account and a rota behind them so it does not depend on one person's availability. The precise response commitments are agreed in writing rather than implied.
Conditions with an agreed automatic response — falling back to a secondary feed, disabling a failing gateway, suspending a symbol whose price source has gone stale. These are defined with you in advance, because an automatic action taken without agreement is its own kind of incident.
Into the channels your team already uses, alongside ours. An alert that only exists inside a vendor's system is one your people cannot act on independently.
Yes. Anything that triggered a response is reported, including the ones contained before they had client impact. Only reporting the visible failures gives a misleading picture of how the environment is actually behaving.
Yes. You get visibility into the same signals rather than a summary of them, so you can form your own view of how the platform is running instead of relying on our characterisation of it.
Still have a question?
A specialist will answer it directly, with your set-up in mind.
Ask a specialistFind out what is not being watched
We will check what your current monitoring covers, where it is silent, and whether anybody is positioned to act on it.