For Brokers
Every venue claims good execution. This is how you check.
Fill rate, rejection rate, latency, realised slippage and price improvement are recorded against every venue on every order. When a renewal comes round, the conversation is about numbers rather than assertions.
Latency, in milliseconds
Venue A
Venue B
Illustrative. Venue B has the better median and the worse tail — the average would have hidden that.
See it live
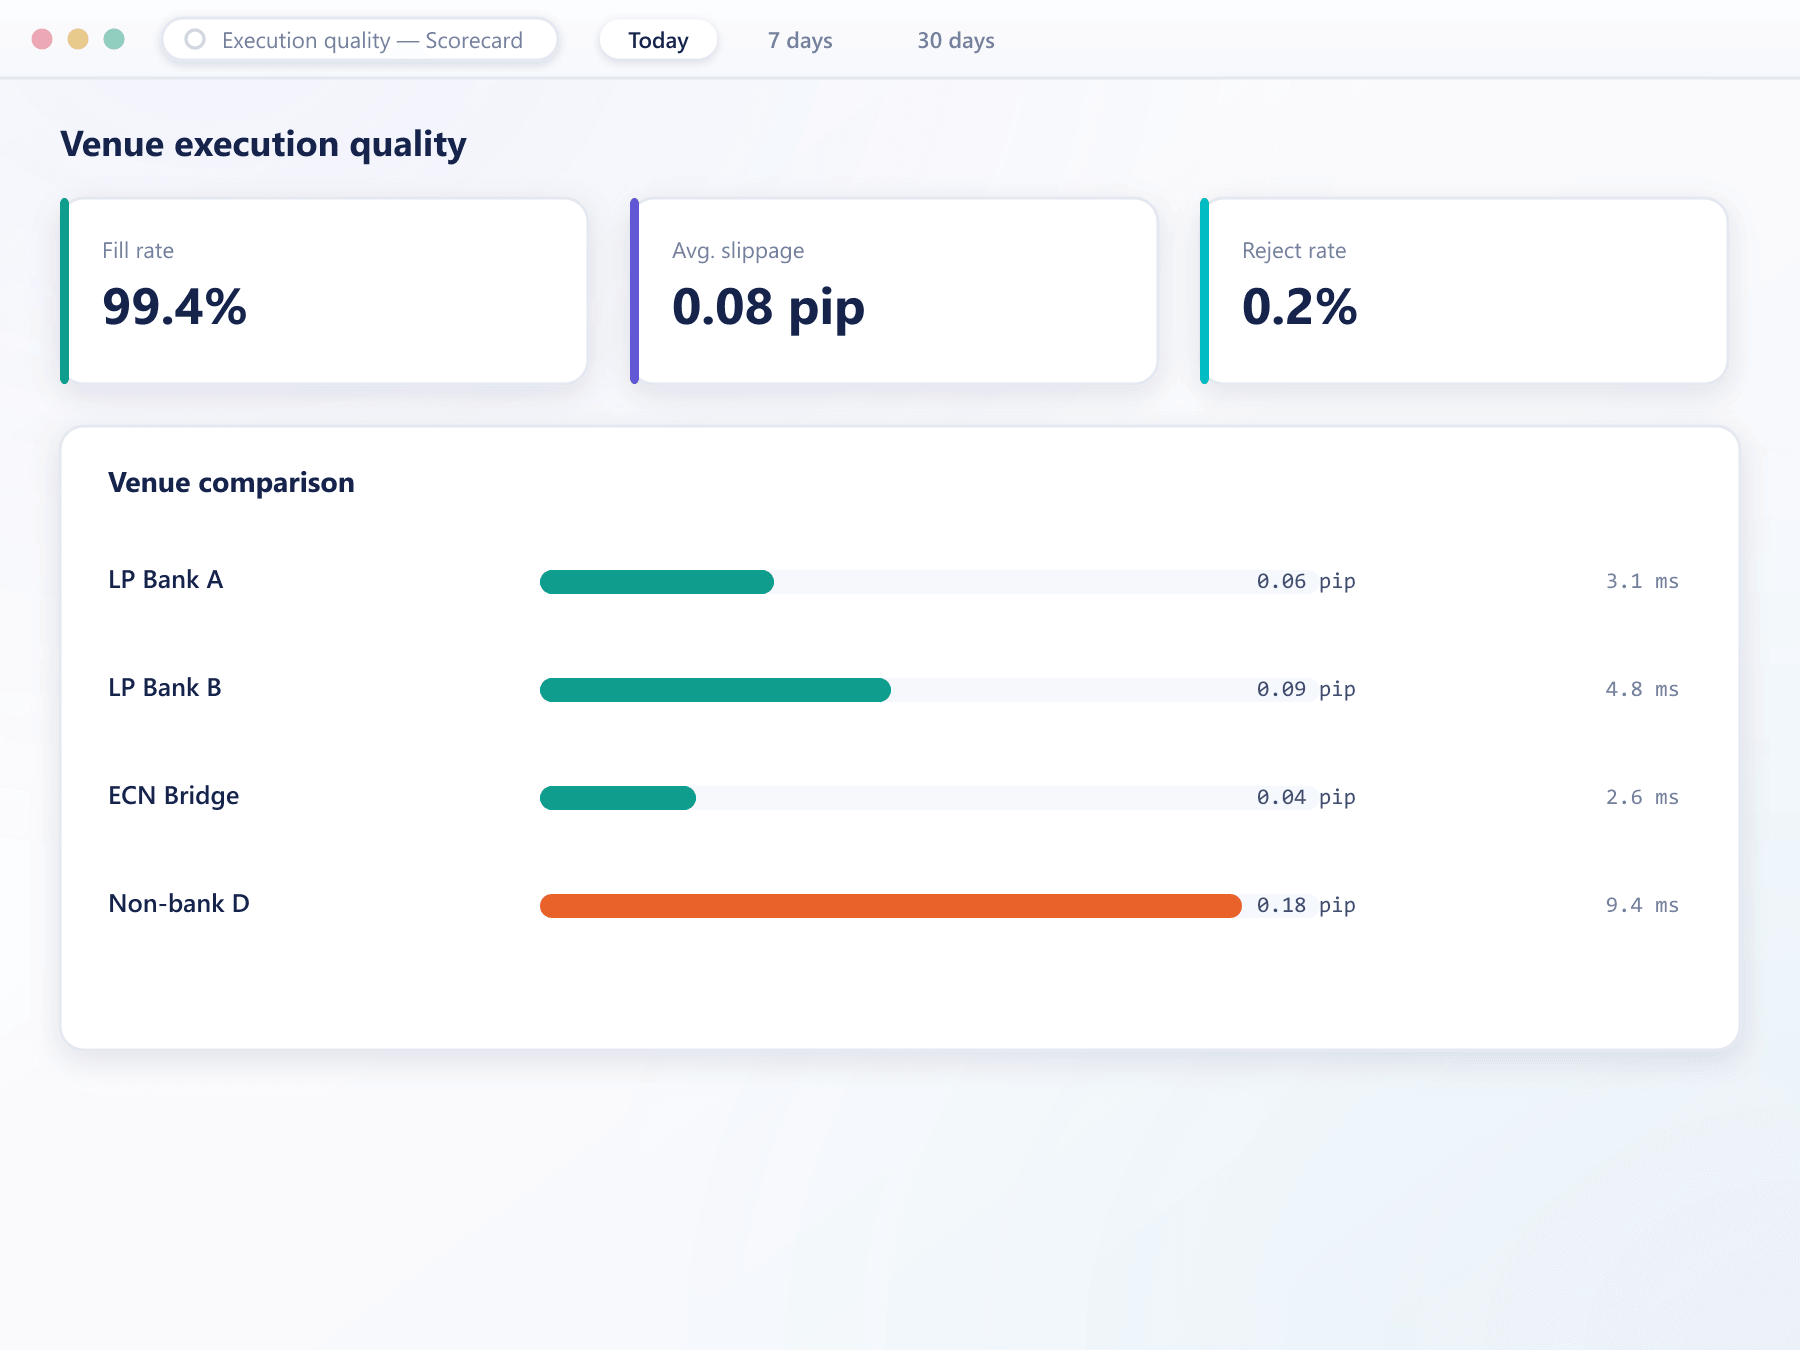
Every venue, on the same scorecard
Fill rate, slippage and latency roll up into KPI tiles per venue, so a comparison that used to take a spreadsheet is a single screen.
The measures worth arguing about
Each of these has changed a routing decision at some point
Fill and rejection rate
How often orders sent to a venue actually execute, and where they do not, the specific reason given.
Latency distribution
Not just the average but the spread, because a venue with a good median and a terrible tail is a venue that will hurt you occasionally.
Realised slippage
The difference between the price the routing decision was based on and the price actually achieved.
Price improvement
Where a venue filled better than quoted, measured and attributed, since it is part of the same comparison.
Feeds routing
The same statistics inform routing rules, so a consistently poor venue can be weighted down automatically.
From order to evidence
The measurement is a byproduct of routing, not a separate exercise
- Reference
The decision price is recorded
When routing selects a venue, the price that decision was based on is written alongside the order. Without it, slippage cannot be measured honestly.
- Outcome
What the venue actually did
Fill or rejection, the achieved price and the round-trip time are recorded against the venue for that order.
- Aggregate
Rolled up per venue and instrument
Measures are aggregated across periods and broken down by instrument, since venue quality is rarely uniform across a product range.
- Apply
Routing follows the evidence
Weightings are adjusted, or a venue is removed from an instrument entirely, and the effect appears in the next period's numbers.
What the evidence is worth
Execution cost compounds quietly, and it is the easiest cost to argue down with data.
Better renewals
A venue conversation backed by measured performance goes differently.
Cheaper execution
Weighting away from poor venues reduces cost without any commercial negotiation at all.
Tail risk visible
Latency distribution exposes venues that are fine until they suddenly are not.
Defensible to clients
Where best execution has to be demonstrated, the records already exist.
FAQ
Execution quality: common questions
5 short answers to what teams ask before a demo.
Against the price the routing decision was based on, which is recorded alongside the order at the moment of the decision. Measuring against anything else produces a number that is easy to flatter.
Because a venue with a good median and a bad tail will fill you well most of the time and badly exactly when the market is moving. The distribution shows that; the average hides it.
Yes, and it should be. Venue quality is rarely uniform — a source that is excellent in major pairs can be poor in a thinner product, and routing should reflect that.
They can. Routing rules can weight by measured performance, and a venue whose rejection rate crosses a threshold is removed from routing until it recovers.
Yes. Where a venue fills better than the reference price, that is measured and attributed in the same way as slippage, so the comparison between venues is even-handed.
Still have a question?
A specialist will answer it directly, with your set-up in mind.
Ask a specialistBenchmark your current execution
Send us a period of your trade history and we will produce the venue comparison you are missing.