For Liquidity Providers
Every taker feels valuable until you measure them
Volume alone tells you almost nothing. Hit rate, markout and rejection behaviour per counterparty and per instrument tell you which relationships justify the price you are showing them.
Taker A
18%Neutral0.4%Taker B
61%Adverse0.6%Taker C
24%Favourable3.9%Illustrative. High hit rate with adverse markout is the pattern worth pricing for.
See it live
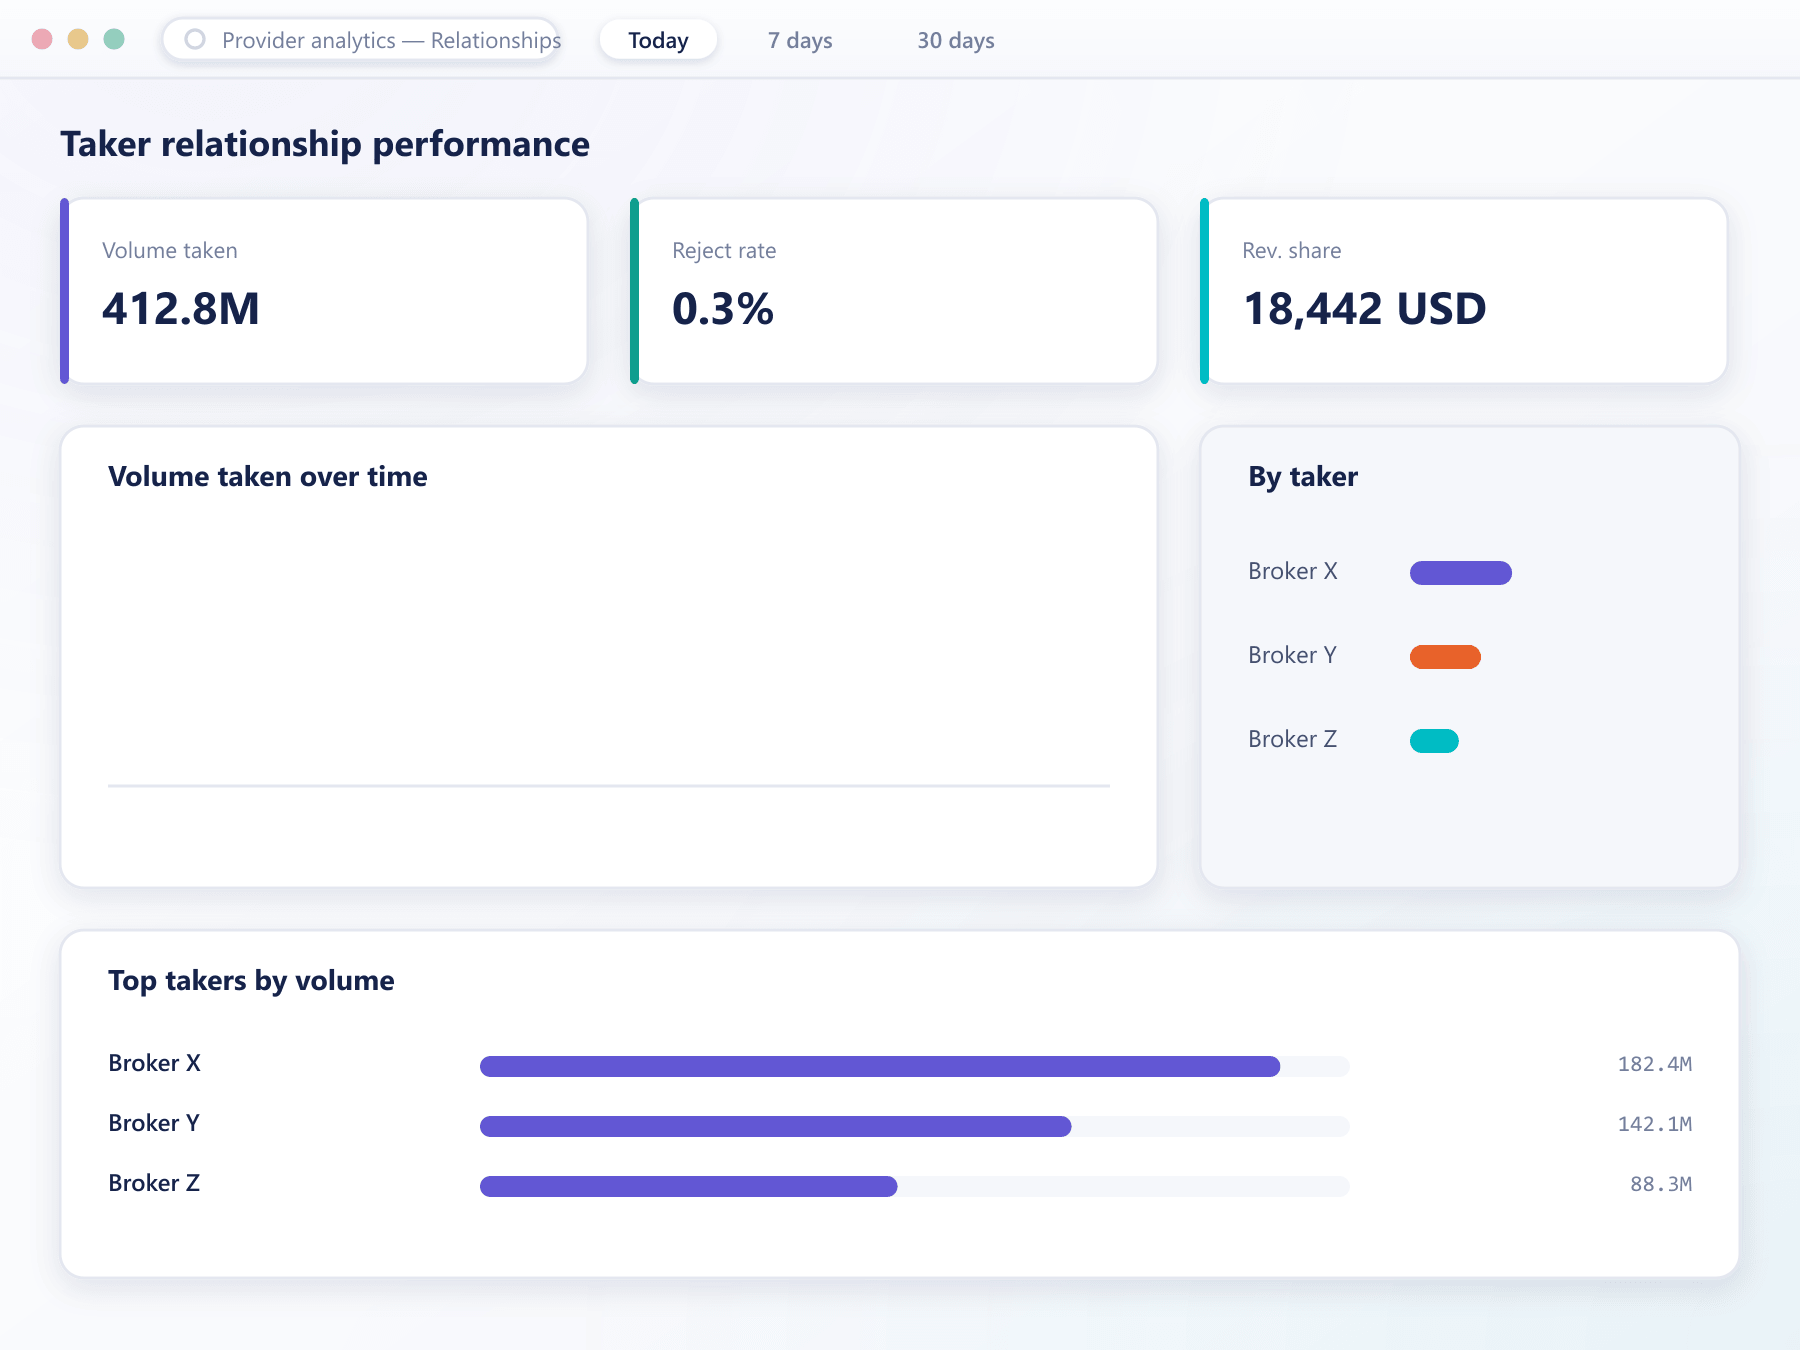
Relationship health, at a glance
Revenue, hit rate and markout roll up into KPI tiles and a trend chart, so a relationship worth revisiting stands out immediately.
The measures that change a decision
Volume is a vanity number. These are the ones that decide whether a relationship stays.
Hit rate
How often a taker trades against the quotes they receive, which is the first indication of whether they are genuinely using your stream.
Markout
How the market moved immediately after each fill, aggregated per taker. It is the clearest signal of whether flow is informed.
Rejection behaviour
Rejection rates and their reasons per taker, which usually points at a technical problem before it becomes a commercial one.
Revenue per relationship
Markup earned per taker set against the credit extended and the exposure they generate.
Instrument breakdown
Every measure available per instrument as well as per taker, since a relationship is often good in one symbol and poor in another.
From fill to conclusion
Everything below is derived from records the engine writes anyway
- 1Capture
Quotes and fills both recorded
Published quotes are recorded alongside executions, which is what makes hit rate calculable rather than estimated.
- 2Observe
Price movement after each fill
The market is sampled at configured intervals after every execution, producing the markout series per fill.
- 3Aggregate
Rolled up by relationship
Measures are aggregated per taker, per instrument and per period, so a pattern is visible rather than buried in individual trades.
- 4Act
Terms follow the evidence
Markup, entitlements or controls for that relationship are adjusted in the console, and the effect appears in the next period's numbers.
What measurement changes
Pricing a relationship correctly is worth more than winning another one.
Priced by behaviour
Markup can follow the actual cost of serving a taker rather than a guess.
Informed flow identified
Markout exposes counterparties whose flow consistently moves against you.
Technical issues caught
A rejection pattern usually indicates a mapping or session problem, not a commercial one.
Credit allocated well
Revenue against credit extended shows where your balance sheet is working hardest.
FAQ
Provider analytics: common questions
5 short answers to what teams ask before a demo.
It measures how the market moved immediately after a fill. Consistently adverse markout on one counterparty's flow suggests they are trading on information you do not have, which is a pricing decision rather than a fairness complaint.
From published quotes set against executions for that taker. Because quotes are recorded as well as fills, the figure is calculated rather than estimated from volume.
Yes. Every measure is available per instrument as well as per taker, which matters because a relationship is frequently profitable in one symbol and loss-making in another.
Yes. Any saved view with its filters can run on a schedule to a named recipient list, so the weekly relationship review arrives without anyone generating it.
Usually a technical problem rather than a commercial one. A concentration of rejections against a single reason typically points at a symbol mapping, a precision mismatch or a session configuration issue.
Still have a question?
A specialist will answer it directly, with your set-up in mind.
Ask a specialistAnalyse a relationship with us
Bring a counterparty you are unsure about and we will build the analysis that answers it.